← Linear relations

Linear relations: recap

Answer each question in your head or on paper first, then check it.

Rules, tables and graphs

1. Growing patterns

Try firstA pattern has 6, 11, 16 tiles in Figures 1 to 3. Write the rule and find Figure 20.

Check your answer

s = 5n + 1; Figure 20 has 101 tiles.

A growing pattern adds the same amount each time. Look at what each new figure adds: for a row of squares made of sticks, each new square adds 3 sticks (it shares a side).

So figure $n$ has $n$ lots of 3, plus what every figure has before that: 1 stick on the left. The rule is $s = 3n + 1$.

The rule gives any figure without drawing it: Figure 10 has $3 \times 10 + 1 = 31$ sticks. To go backwards, solve: $3n + 1 = 46$ gives $n = 15$.
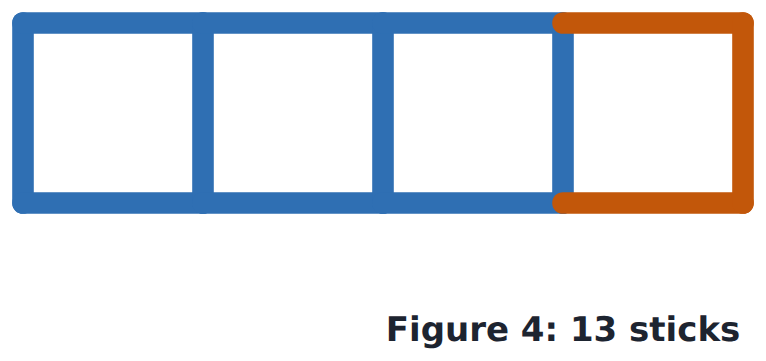
Figure 4 has 13 sticks. Each new square adds 3 (orange), and there is 1 extra stick at the start: s = 3n + 1.
Figure 4 has 13 sticks. Each new square adds 3 (orange), and there is 1 extra stick at the start: s=3n+1s = 3n + 1.
Each figure adds the same amount: that gives the rule · Sound on for the voiceover
Open the lesson →

2. Tables from rules

Try firstMake a table for y = 4x − 3 with the inputs 0, 1, 2, 3. Write the pairs.

Check your answer

Outputs −3, 1, 5, 9. Pairs (0, −3), (1, 1), (2, 5), (3, 9).

A rule like $y = 2x + 3$ turns an input $x$ into an output $y$. To make a table of values, choose some inputs, put each one in place of $x$, and work out its output.

Each input and its output make an ordered pair $(x, y)$: input first, output second. For $x = 4$: $y = 2(4) + 3 = 11$, so the pair is $(4, 11)$, not $(11, 4)$ and not $(4, 4)$.

To go backwards (which input gives an output of 15?), set the rule equal to it and solve: $2x + 3 = 15$, so $x = 6$.

Input x, work out y, write the pair (x, y) · Sound on for the voiceover
Open the lesson →

3. Plotting a rule

Try firstPlot the pairs of y = 3x − 1 for x = 0 to 3. Describe the graph.

Check your answer

(0, −1), (1, 2), (2, 5), (3, 8): a straight line going up 3 for each step right, crossing the y-axis at −1.

To plot the point $(x, y)$, start at $(0, 0)$, go across $x$ and then up $y$. A negative number goes left or down.

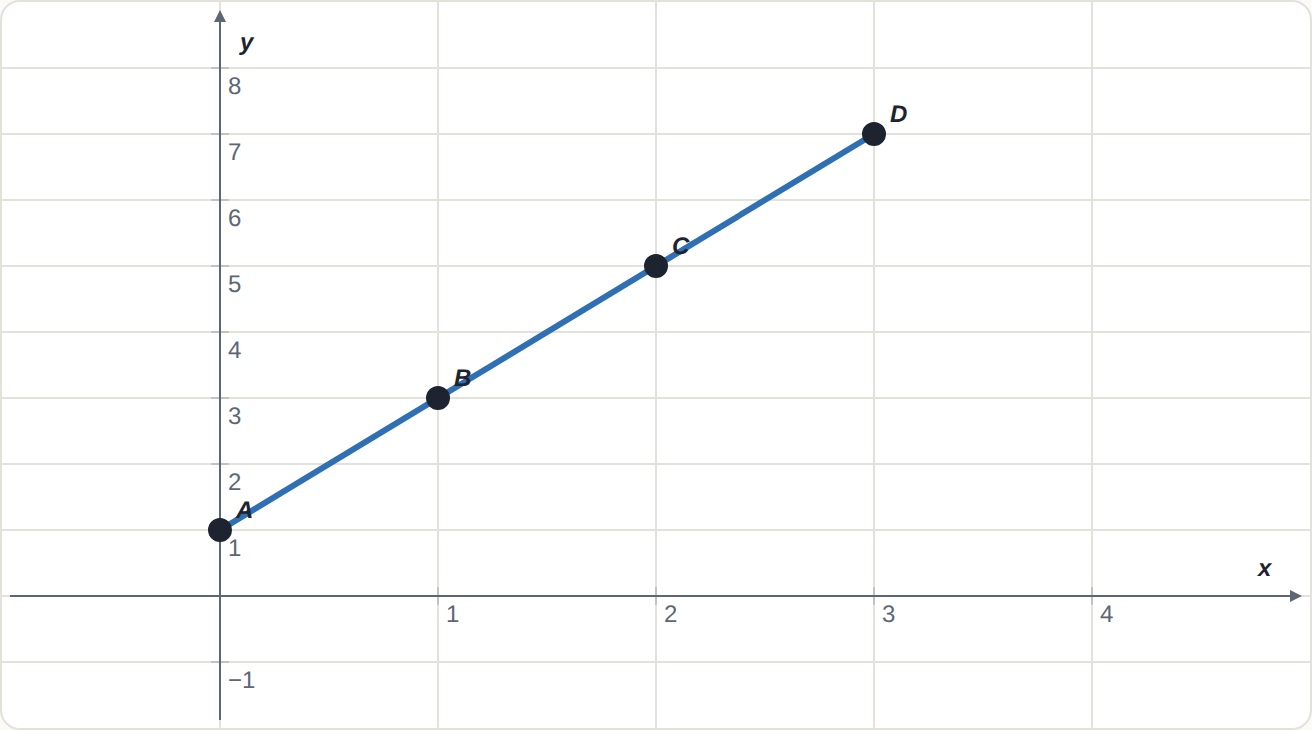
Plot each ordered pair from a rule's table. For $y = 2x + 1$ the pairs $(0, 1)$, $(1, 3)$, $(2, 5)$, $(3, 7)$ lie on a straight line, because each step of 1 across adds the same amount (2) to $y$.

Describe the line by which way it goes and how much for each step: "up 2 for each step right, crossing the $y$-axis at 1". If the steps in the table change, the points curve instead.

The pairs of y = 2x + 1: (0, 1), (1, 3), (2, 5), (3, 7). They lie on a straight line, going up 2 for each step right.
The pairs of y=2x+1y = 2x + 1: (0,1)(0, 1), (1,3)(1, 3), (2,5)(2, 5), (3,7)(3, 7). They lie on a straight line, going up 2 for each step right.
Open the lesson →

4. Reading a graph

Try firstA graph of height (cm) against age (years) has the point (12, 150). What does it say?

Check your answer

At 12 years the height is 150 cm.

A graph of real data pairs two measurements. Check the axis labels first: one measurement is across (the bottom axis) and the other is up the side.

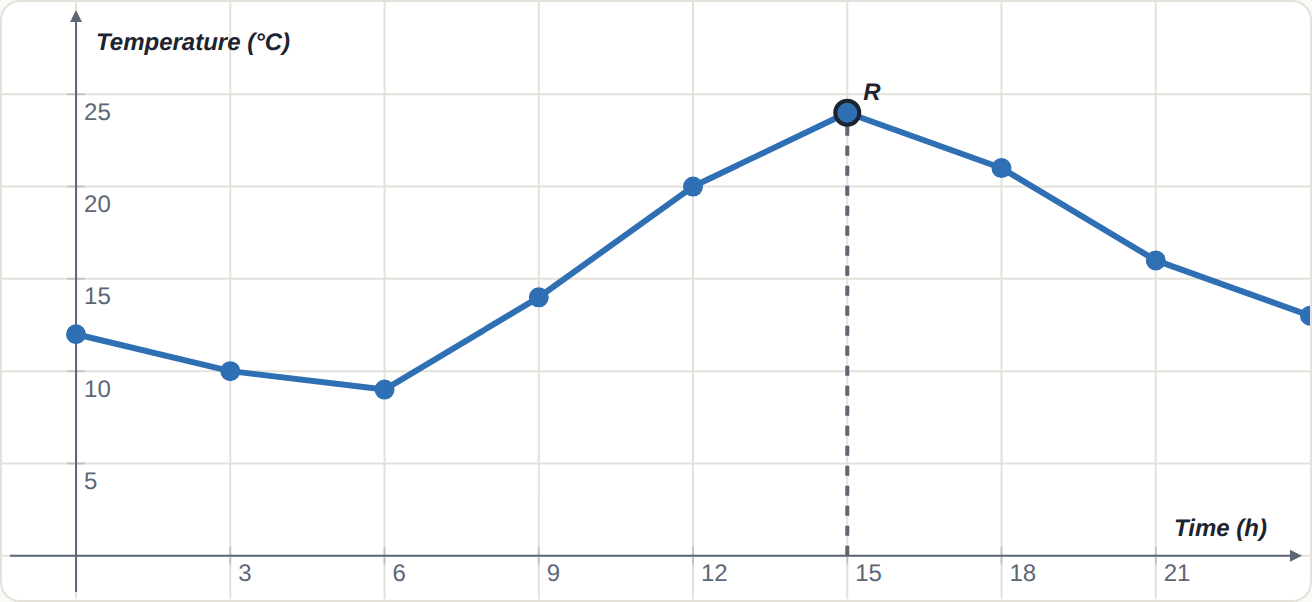
To read a graph, find the value you know on its own axis, go to the line, then read across to the other axis. The point $(15, 24)$ on a graph of temperature against time says: at 15 hours the temperature is 24 °C. Give the units in your answer.

The two numbers of a point belong to different axes. Swapping them gives a different (and wrong) statement.

At 15 hours the temperature is 24 °C: find 15 on the Time axis, go up to the line, read across to the Temperature axis. The point is (15, 24).
At 15 hours the temperature is 24 °C: find 15 on the Time axis, go up to the line, read across to the Temperature axis. The point is (15,24)(15, 24).
Find one value, go to the line, read the other · Sound on for the voiceover
Open the lesson →

5. Describing a relationship

Try firstA graph of a tap's water in a bucket (L) against time (min) goes up, then is flat. Describe it.

Check your answer

As time increases, the amount of water increases, then stays constant (the tap was turned off).

A graph shows how one measurement changes as another changes. Describe it one section at a time: as time increases, the other measurement increases, decreases or stays constant.

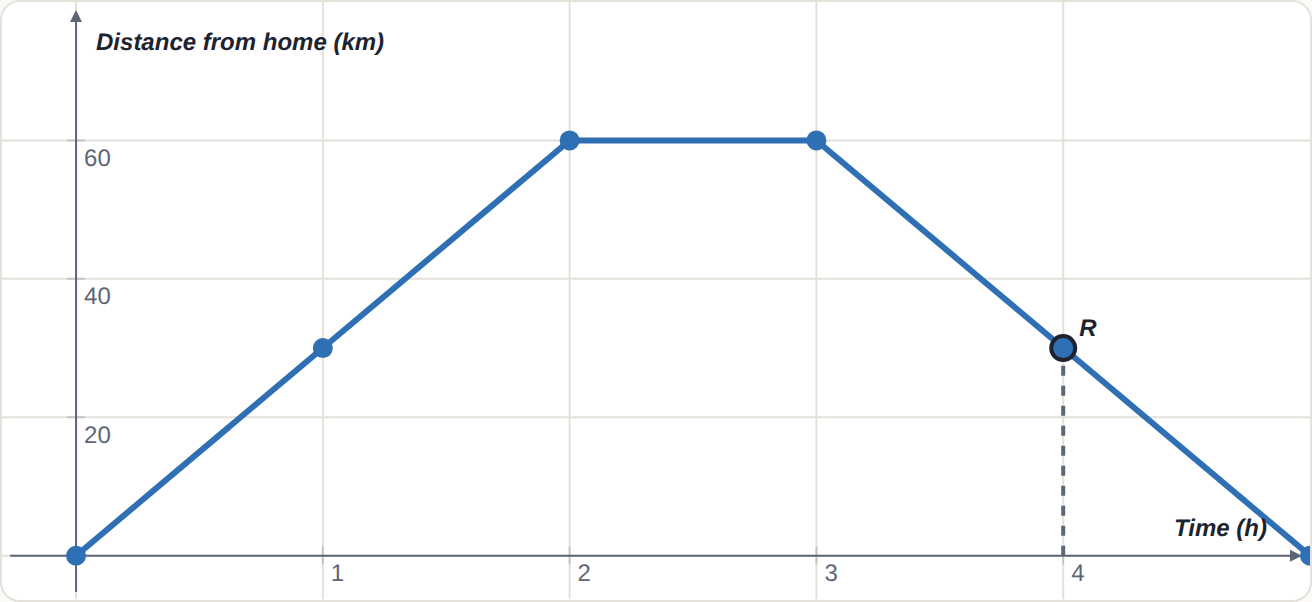
For the bike ride: from 0 to 2 hours the distance from home increases, from 2 to 3 hours it stays constant (the cyclist has stopped), and from 3 to 5 hours it decreases (riding home).

A graph is not a picture of the journey. A line going down does not mean going downhill: it means the measurement on the up-axis is getting smaller.

A bike ride. 0 to 2 hours: the distance from home increases. 2 to 3 hours: it stays constant (stopped). 3 to 5 hours: it decreases (riding home).
Describe one section at a time · Sound on for the voiceover
Open the lesson →

12. Changing one thing at a time

Try firstIn V = lwh with l = 2, w = 3, h = 4, h goes to 8 and nothing else changes. What is V?

Check your answer

48: 2 × 3 × 8, double the 24 it was.

To see what one variable does in a formula, change that variable only and keep the others the same, then record the results in a table.

In $V = lwh$, doubling any one variable doubles $V$. In $A = s \times s$, doubling $s$ makes $A$ four times as big.

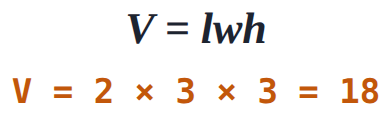
With l = 2 and w = 3 held still, a taller box (h = 3) has volume 2 \times 3 \times 3 = 18.
With l=2l = 2 and w=3w = 3 held still, a taller box (h = 3) has volume 2×3×3=182 \times 3 \times 3 = 18.
Only h changes · Sound on for the voiceover
Open the lesson →

Lines and their rules

6. What m does to a line

Try firstWithout plotting, describe the line y = −2x + 1: where does it cross the y-axis, which way does it go, and how steep is it?

Check your answer

It crosses the y-axis at 1 and goes down 2 for each step to the right (m = −2).

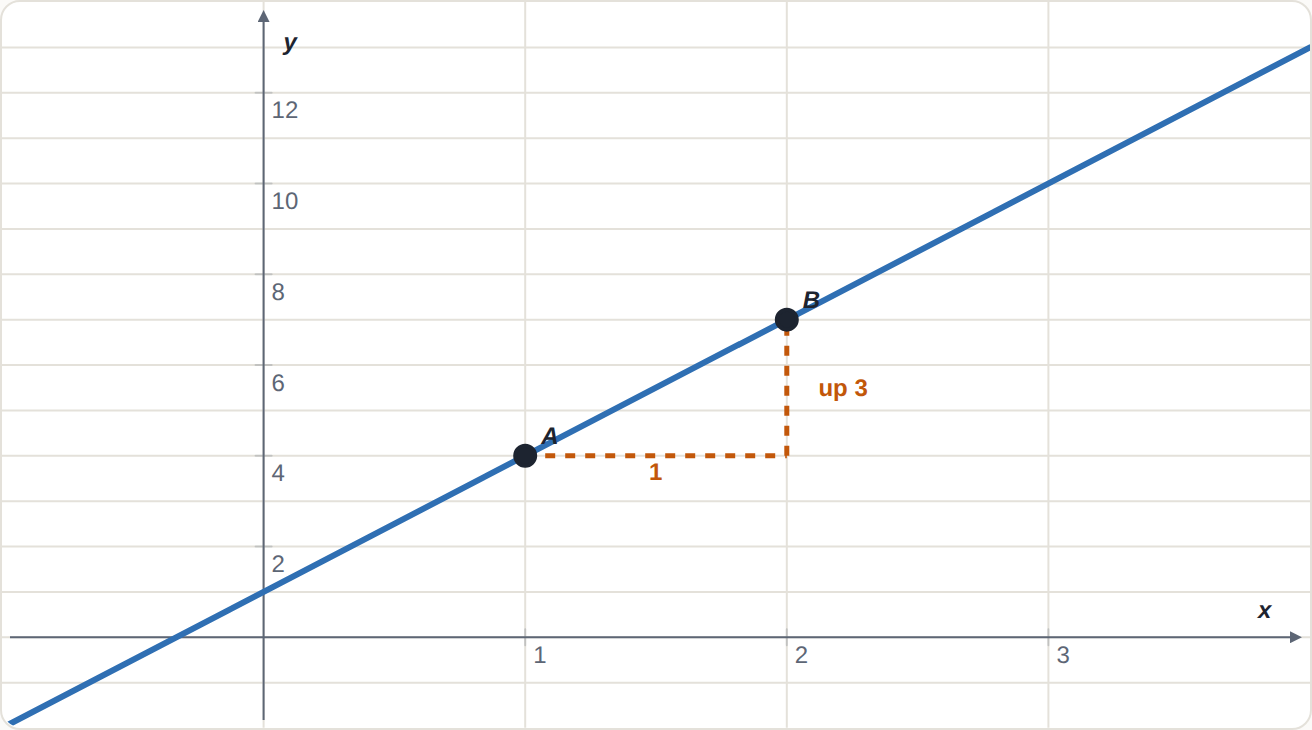
In a rule like $y = 3x + 1$, the number in front of $x$ is called $m$. It tells you how far the line goes up for each step of 1 to the right.

Work it out one step at a time: when $x = 0$, $y = 1$; when $x = 1$, $y = 4$; when $x = 2$, $y = 7$. Each step right, $y$ goes up by 3. That is $m$.

A bigger $m$ makes the line steeper. $m = 0$ makes it flat. A negative $m$ makes it go down. Changing $m$ does not move where the line crosses the $y$-axis: that is the number on its own, $c$.

y = 3x + 1: one step right, up 3. That 3 is m.
y=3x+1y = 3x + 1: one step right, up 3. That 3 is mm.
m is how far the line goes up for each step right · Sound on for the voiceover
Open the lesson →

7. What c does to a line

Try firstAre y = 3x + 2 and y = 3x − 5 parallel? Where does each cross the y-axis?

Check your answer

Yes, both have m = 3. The first crosses at 2, the second at −5.

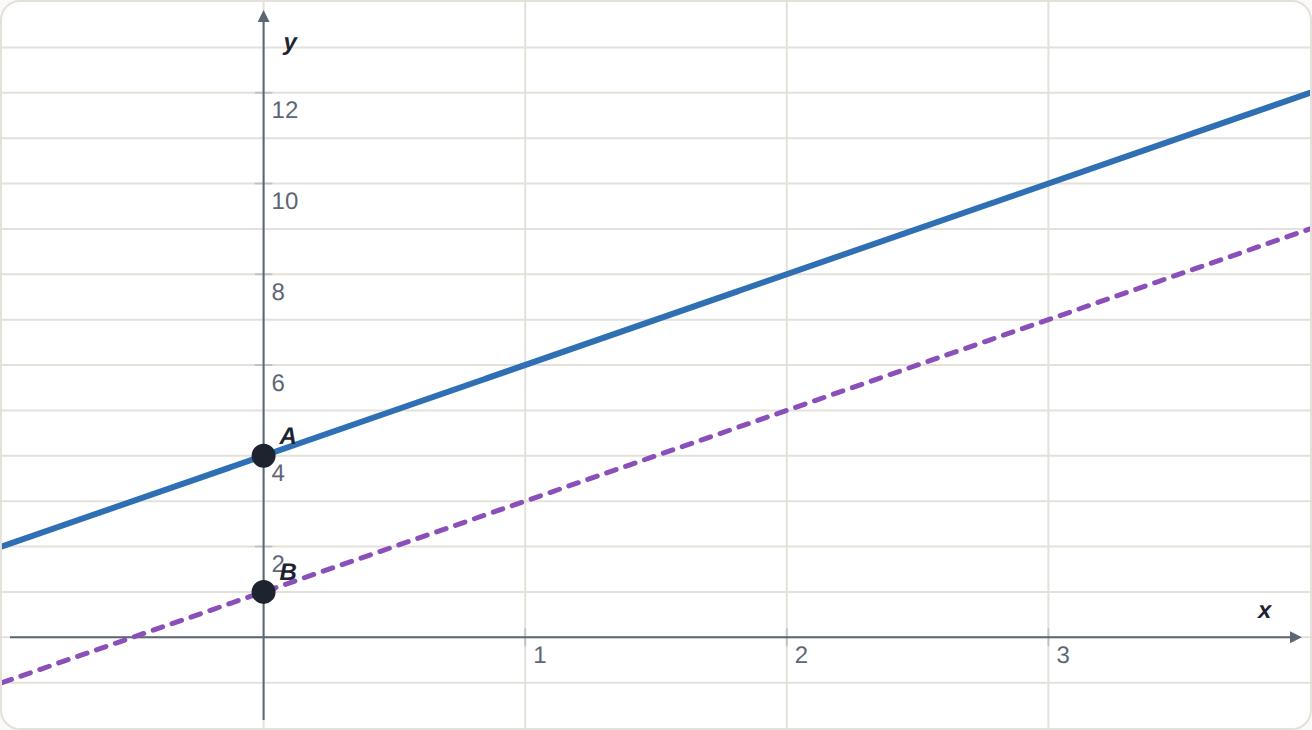
In $y = mx + c$, $c$ is the number on its own. It is where the line crosses the $y$-axis: when $x = 0$, $mx$ is 0, so $y = c$.

Changing $c$ moves the whole line up or down. It does not change the steepness, because $m$ stays the same: $y = 2x + 4$ is $y = 2x + 1$ moved up 3.

Lines with the same $m$ are parallel: equally steep, so they never meet.

y = 2x + 4 is y = 2x + 1 moved up 3. Same m, so they are parallel.
y=2x+4y = 2x + 4 is y=2x+1y = 2x + 1 moved up 3. Same mm, so they are parallel.
c moves the line up or down; the steepness stays the same · Sound on for the voiceover
Open the lesson →

8. Lines and regions

Try firstGraph y ≥ −2x + 3 (describe the boundary and the side). Is (1, 1) in it?

Check your answer

Solid line through (0, 3), down 2 for each step right; shade above. (1, 1): 1 ≥ 1, true: on the boundary, so in.

One-letter lines: $x = 3$ is vertical (every point has $x = 3$); $y = -2$ is horizontal.

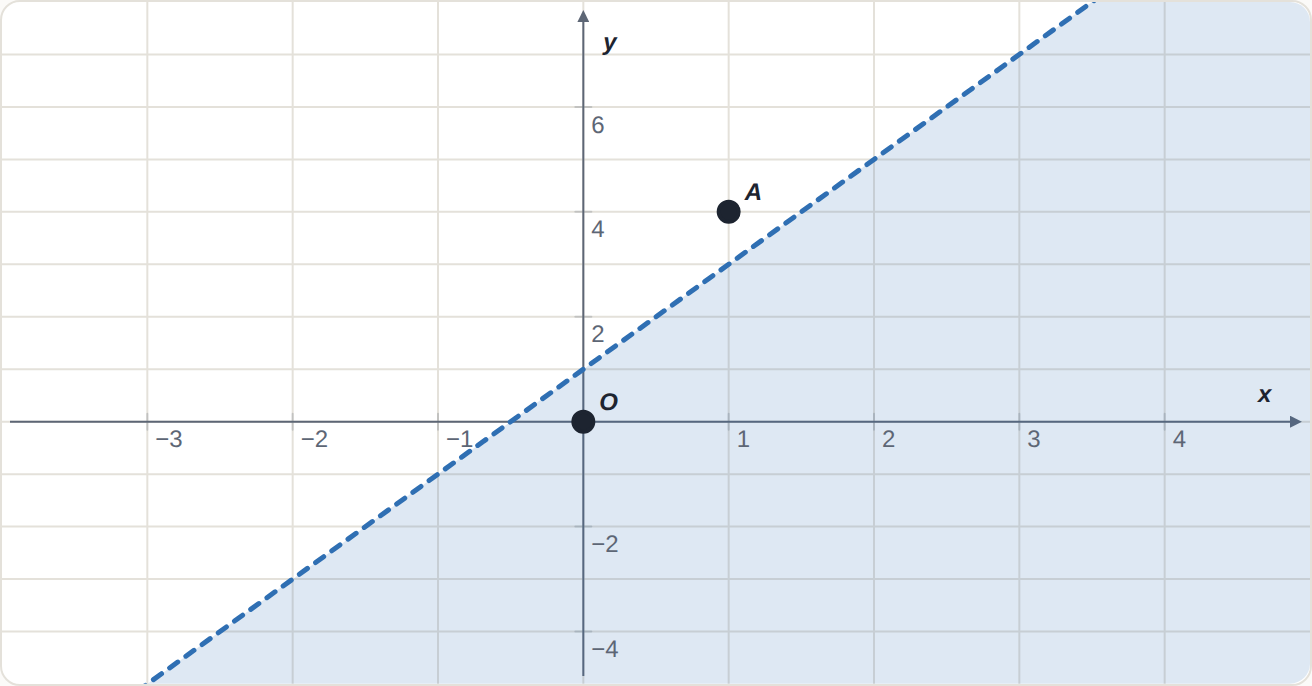
An inequality such as $y < 2x + 1$ is a region: every point that makes it true. To graph it:

  1. Draw the boundary line $y = 2x + 1$: dashed for $<$ and $>$ (its points are not included), solid for $\le$ and $\ge$.
  2. Test a point not on the line, often $(0, 0)$: $0 < 1$ is true.
  3. Shade the side of the test point if it was true, the other side if it was false.
y < 2x + 1: below the dashed line. O(0, 0) is in it (0 < 1); A(1, 4) is not (4 < 3 is false).
y<2x+1y < 2x + 1: below the dashed line. O(0,0)O(0, 0) is in it (0<10 < 1); A(1,4)A(1, 4) is not (4<34 < 3 is false).
A line, then a region · Sound on for the voiceover
Open the lesson →

Solving and modelling with lines

9. Solving equations with graphs

Try firstThe lines y = 2x − 3 and y = 5 meet at (4, 5). Solve 2x − 3 = 5 and check your answer.

Check your answer

x = 4. Check: 2 × 4 − 3 = 5.

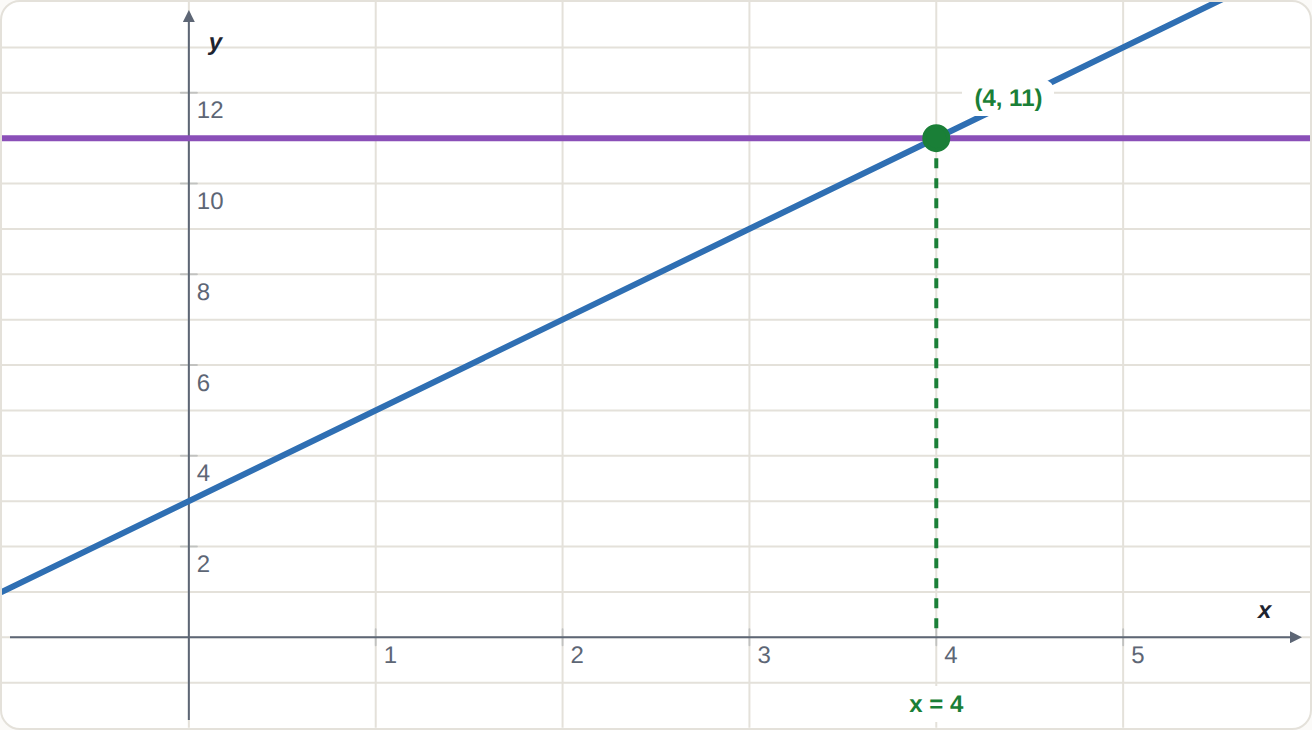
An equation says two things are equal. Draw each side as a line: for $2x + 3 = 11$, draw $y = 2x + 3$ and $y = 11$.

Where the lines meet, both sides have the same value. The solution is the $x$ of that point: here the lines meet at $(4, 11)$, so $x = 4$. The 11 is the value of both sides, not the answer.

Check by substitution: $2 \times 4 + 3 = 11$. If the lines are parallel, they never meet, and the equation has no solution.

y = 2x + 3 meets y = 11 at (4, 11), so 2x + 3 = 11 when x = 4.
y=2x+3y = 2x + 3 meets y=11y = 11 at (4,11)(4, 11), so 2x+3=112x + 3 = 11 when x=4x = 4.
The solution is the x where the two lines meet · Sound on for the voiceover
Open the lesson →

10. Rules from real situations

Try firstA swimming pool charges a 50 dollar membership plus 4 dollars a visit. Write the rule for the total T for v visits, and say what each number means.

Check your answer

T = 4v + 50. 4 is the cost per visit (m); 50 is the membership, paid once (c).

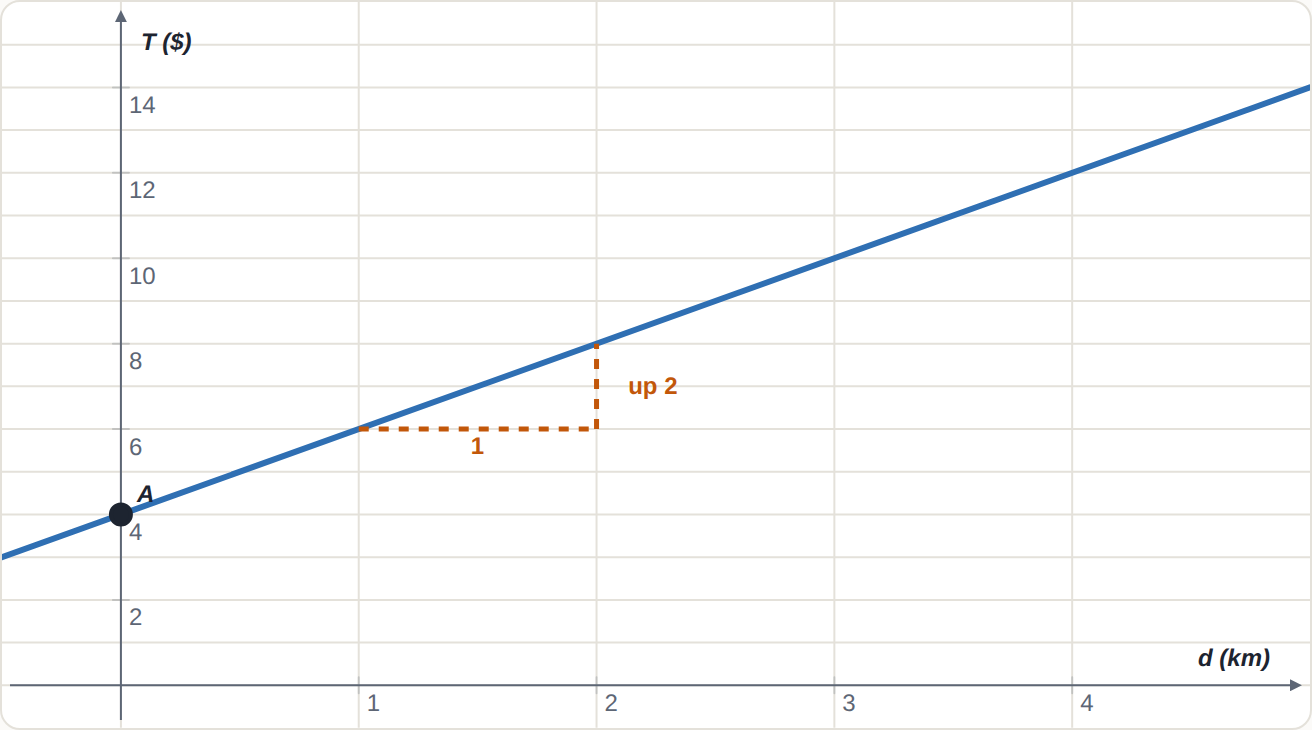
Many real amounts are a starting amount plus a rate. A taxi costs 4 dollars to get in, then 2 dollars for each km: $T = 2d + 4$.

The starting amount is $c$: it is the value when nothing has happened yet (0 km), where the line crosses the axis. The rate is $m$: the words "per", "each" or "every" tell you it is the amount for each one more, how far the line goes up for each step.

The order of the numbers in the words does not matter. Ask: which is paid once (c), and which is paid again and again (m)?

A taxi: 4 dollars to get in (where the line starts) and 2 dollars per km (up 2 for each km). T = 2d + 4.
A taxi: 4 dollars to get in (where the line starts) and 2 dollars per km (up 2 for each km). T=2d+4T = 2d + 4.
The starting amount is c; the rate is m · Sound on for the voiceover
Open the lesson →

11. Comparing two plans

Try firstPlan X costs 15 dollars plus 6 per GB; Plan Y costs 33 dollars flat. Which is cheaper for 2 GB and for 5 GB? Where do they cost the same?

Check your answer

2 GB: X (27 dollars vs 33). 5 GB: Y (45 vs 33). They cost the same at 3 GB (33 dollars).

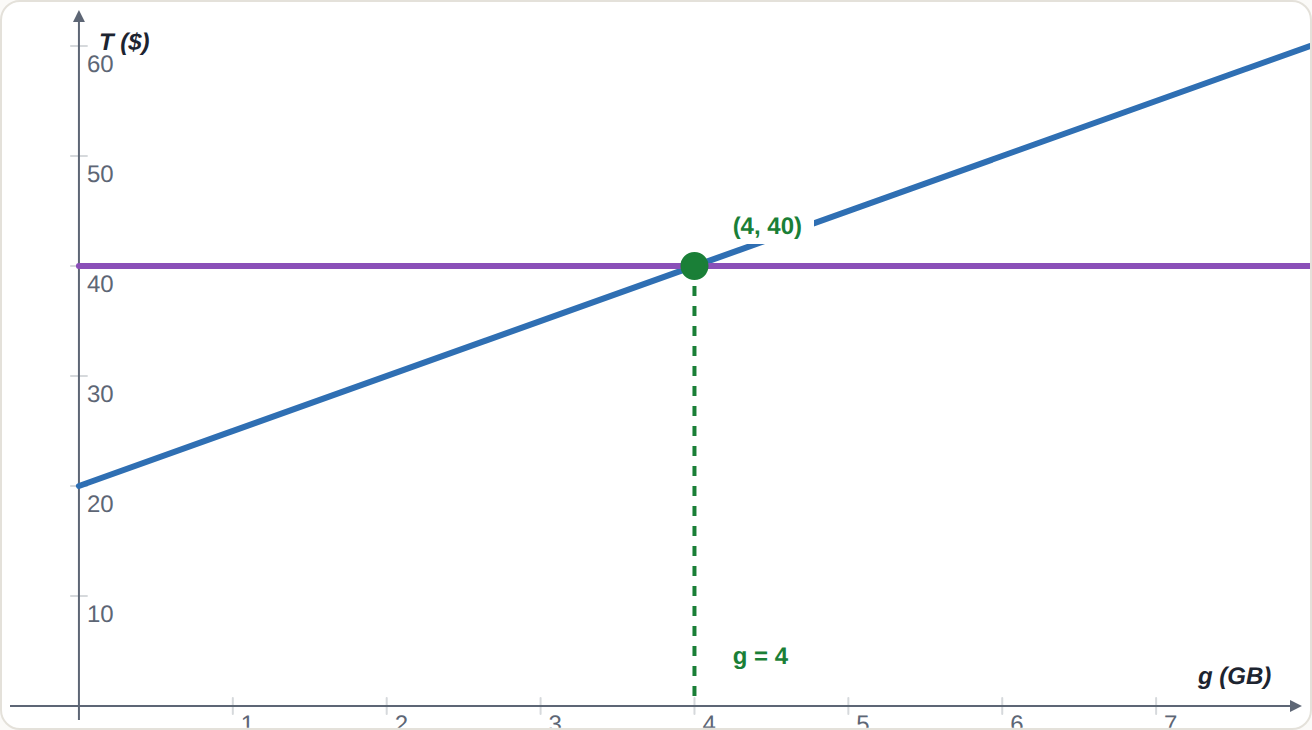
To compare two plans, draw both rules on one graph. Where the lines cross, the plans cost the same.

On each side of the crossing, the lower line is the cheaper plan. A plan with a lower fee is cheaper for small amounts, but a plan with a lower rate wins for large amounts.

Always answer in words ("Up to 4 GB, Plan A is cheaper"), and check the answer makes sense: you cannot use negative data or buy half a ticket, so a model only fits some values.

Plan A (T = 5g + 20) and Plan B (T = 40) cost the same at 4 GB. Below 4 GB, A is lower (cheaper); above 4 GB, B is.
Plan A (T=5g+20T = 5g + 20) and Plan B (T=40T = 40) cost the same at 4 GB. Below 4 GB, A is lower (cheaper); above 4 GB, B is.
Where the lines cross, the plans cost the same · Sound on for the voiceover
Open the lesson →