Plotting a rule
Plot each ordered pair from a rule's table as a point, across first and then up. For a rule like y = 2x + 1, the points lie on a straight line.
A table of numbers hides its pattern; a graph shows it at a glance. Plotting the pairs turns a rule into a picture you can read.
In the last lesson you made tables of ordered pairs from rules. Now you plot them. To plot the point , start at , go across , then up . Then look at the shape the points make.
- Predict: Read the problem and decide what you think before you try anything. A wrong guess is fine: it shows you what to look for.
- Try: Try it on the board and compare the result with your prediction.
- Investigate: Work out why it happens, one step at a time.
- Modify: Change the problem on purpose and see what happens.
- Practise: A few on your own, to check you have it.
- Make: Make your own problem using what you have learned. Expect a few tries; that is normal.
Make your prediction first. Help opens once you've locked it in.
What shape?
| 0 | 1 | 2 | 3 | |
|---|---|---|---|---|
| 1 | 3 | 5 | 7 |
How much does go up each time goes up by 1?
Plot the points
| Point | A | B | C | D |
|---|---|---|---|---|
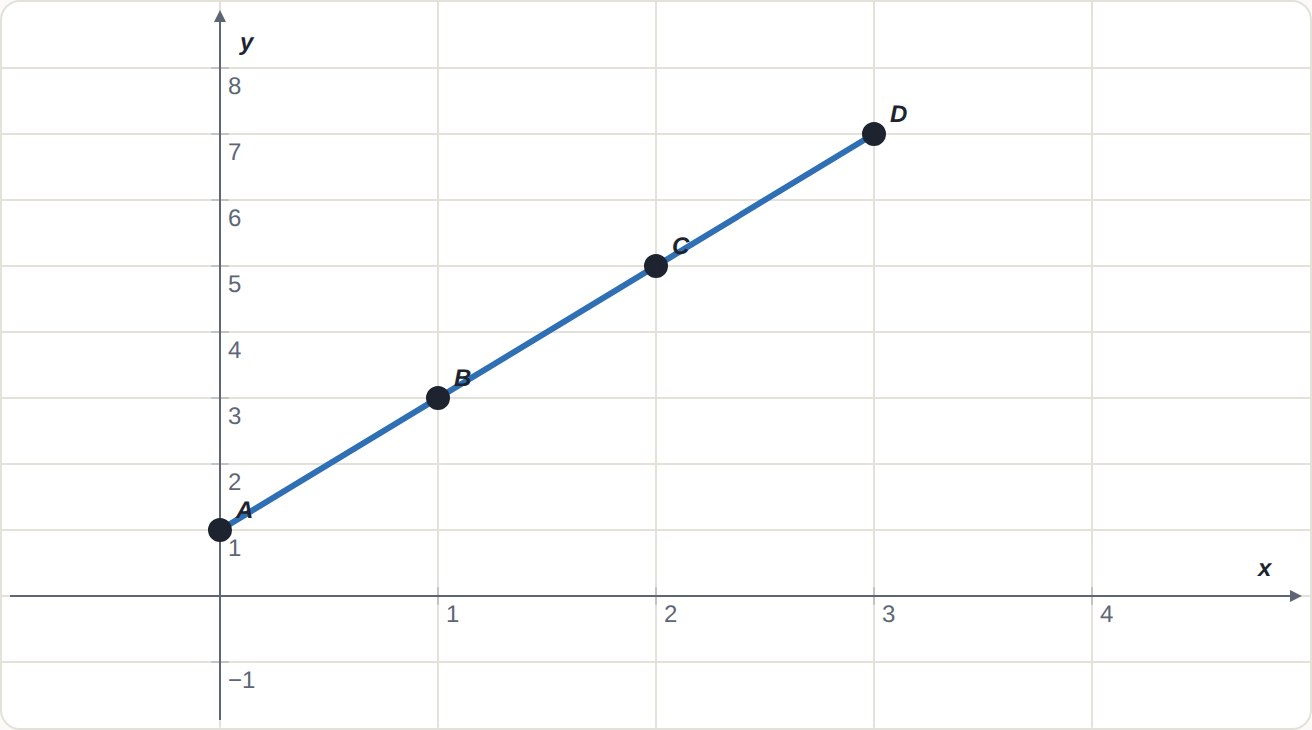
Drag each point from the bottom of the board to its pair. For each one: across first, then up. What shape do they make?
Drag to , to , to and to .
Use the board. This ticks when you get there.
Plotting and describing
Here is how to plot a rule and describe its graph.
- Start with the table of ordered pairs.
- Plot each pair from : across first, then up.
- Plot the rest the same way.
- Each step of 1 across, goes up 2: the same step every time.
- So the points lie on a straight line. Join them with a ruler.
- Describe it: it goes up 2 for each step right and crosses the -axis at 1.
Read Sam's method one line at a time. Which way should he go first?
Sam plots the point . Click the line where his method goes wrong.
New tables
Each task loads a new table. Drag to to the pairs, across then up.
Need a hint?
A negative x means go across to the left first.
Plot it, then look at the steps between the points.
: drag to , to , to and to .
Use the board. This ticks when you get there.
: drag to , to , to and to .
Use the board. This ticks when you get there.
: drag to , to , to and to .
Use the board. This ticks when you get there.
: drag to , to , to and to . Is it a straight line?
Use the board. This ticks when you get there.
Points and graphs
The points of a rule lie on a straight line through , and . Where is the next point, at ? Give its .
Review: for , what is the output when the input is 2?
Your own straight line
Choose where your line starts. Then place the other points so the line goes up 3 for each step to the right.
Stretch: what rule gives your points? Check it with all three.
Need a hint?
Put A anywhere. Then B is 1 across and 3 up from A.
Another hint
C is 1 across and 3 up from B.
Place , and (left to right) on a straight line that goes up 3 for each step right.
Use the board. This ticks when you get there.
For teachers
Students plot ordered pairs from a rule's table, across then up, see that rules adding the same amount each step give straight lines, and describe the line (AC9M7A05, node 3). About 45 minutes.
Open the teacher guide: answers, solutions, slides and a worksheet.
Students will be able to
- I can plot ordered pairs from a table, across first and then up.
- I can describe a straight-line graph by which way it goes and how much for each step.
- I can tell from a table whether its points will lie on a straight line.
Before class
Do the Run and Modify boards yourself first. Points start in a row at the bottom of the board and snap to the grid; students drag each to its pair.
Students should be able to plot points in all four quadrants (Year 6). The new move is reading a table as points and seeing the line: a rule that adds the same amount for each step right always gives a straight line. The last Modify task (y = x × x) is a non-example: the steps change, so the points curve.
Describing the line ("up 2 for each step right, crossing the y-axis at 1") is exactly what m and c will name in the next unit.
Running the lesson
- Predict: take a show of hands. Ask a student who chose 'a curve' what made them think so.
- Run: as students place each point, ask them to say it: 'across 1, up 3'.
- Investigate: model the worked example live on a grid: plot each point saying 'across, then up', then join with a ruler.
- Modify: before the negative inputs, ask: which way is across for a negative x?
- Modify: after the curve, ask: what was different about the steps in the table?
- Make: compare two students' lines: both go up 3 for each step right. Where do they start?
When students get stuck
- A student plots (y, x) by going up first (Sam's mistake). Ask: Which number is x? Which way does the x-axis go? Fix: Say 'along the corridor, then up the stairs': across first, then up.
- A student loses count with negative coordinates. Ask: Is x positive or negative? Which way do you go? Fix: Negative x goes left of the y-axis; negative y goes below the x-axis. Count the squares from (0, 0).
- A student thinks every set of points makes a straight line. Ask: How much does y go up between each pair of points? Fix: Write the steps under the table. Same step every time: straight. Steps that change: a curve.
Stretch and support
Stretch: Plot y = 2x + 1 and y = x + 3 on the same grid. Where do they meet? What does that point mean for both rules?
Support: Give the table with the pairs already written, and a printed grid. Plot two points together before students plot the rest.
Where it leads
Next: graphs of real data, where the points come from measurements, not a rule. Later in the course, the line's steepness and starting point get names: m and c in y = mx + c.
Where it leads in class: science graphs from experiments, and line graphs in any subject.
What each step is for
- what shape?: Committing to a shape before plotting makes the straight line a discovery, and sets up the question of why.
- plot the points: Dragging each point to its pair, across then up, and seeing them line up settles the prediction and shows why: the same step each time.
- plotting and describing: Across first, then up; and a rule that adds the same amount for each step makes a straight line, described by which way it goes and how fast.
- new tables: One change at a time: a subtraction rule, negative inputs, a line going down, and a rule whose points do not make a straight line.
- points and graphs: Reading and plotting points in order, and telling a straight-line rule from its table, mixed; the review is making a table from a rule.
- your own straight line: Placing points so they make a chosen straight line reverses the lesson: from the shape back to the steps between pairs.
- Plot ordered pairs from a table, across first and then up.
- Describe a straight-line graph by which way it goes and how much for each step.
- Tell from a table whether its points will lie on a straight line.