Maths reference: Linear relations
The words and methods from Linear relations, each with an example and, where it helps, a picture of the board.
Print a cheat sheet (the whole course or one unit, with board pictures)
Rules and tables
What each new figure adds goes in front of ; what is there at the start goes on its own. Figure 4 has sticks.

A rule turns each input into an output . Put the input in for : gives .
Choose inputs, work out each output from the rule ( here), and write them in pairs.
Input first, then output. To plot it: across 2 on the -axis, then up 5.

Find the value you know on its axis, go to the line, then read across to the other axis. Sections of a graph increase, decrease or stay constant.
To see what one letter does, change only that letter and keep the others the same. Record the results in a table.
Lines
, the number in front of : one step right, the line goes up (down when is negative). A bigger is steeper; is flat.
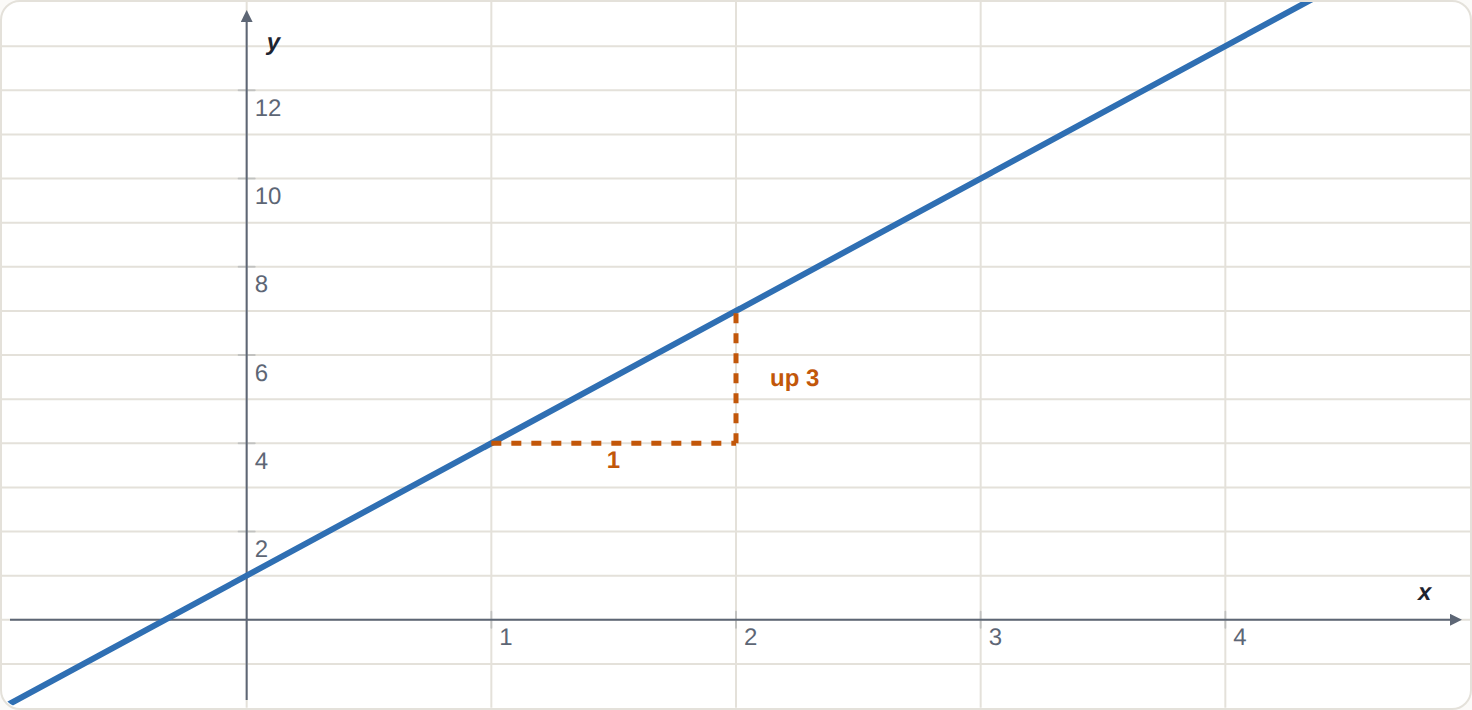
, the number on its own: where the line crosses the -axis (at ). Changing moves the line up or down without changing its steepness.
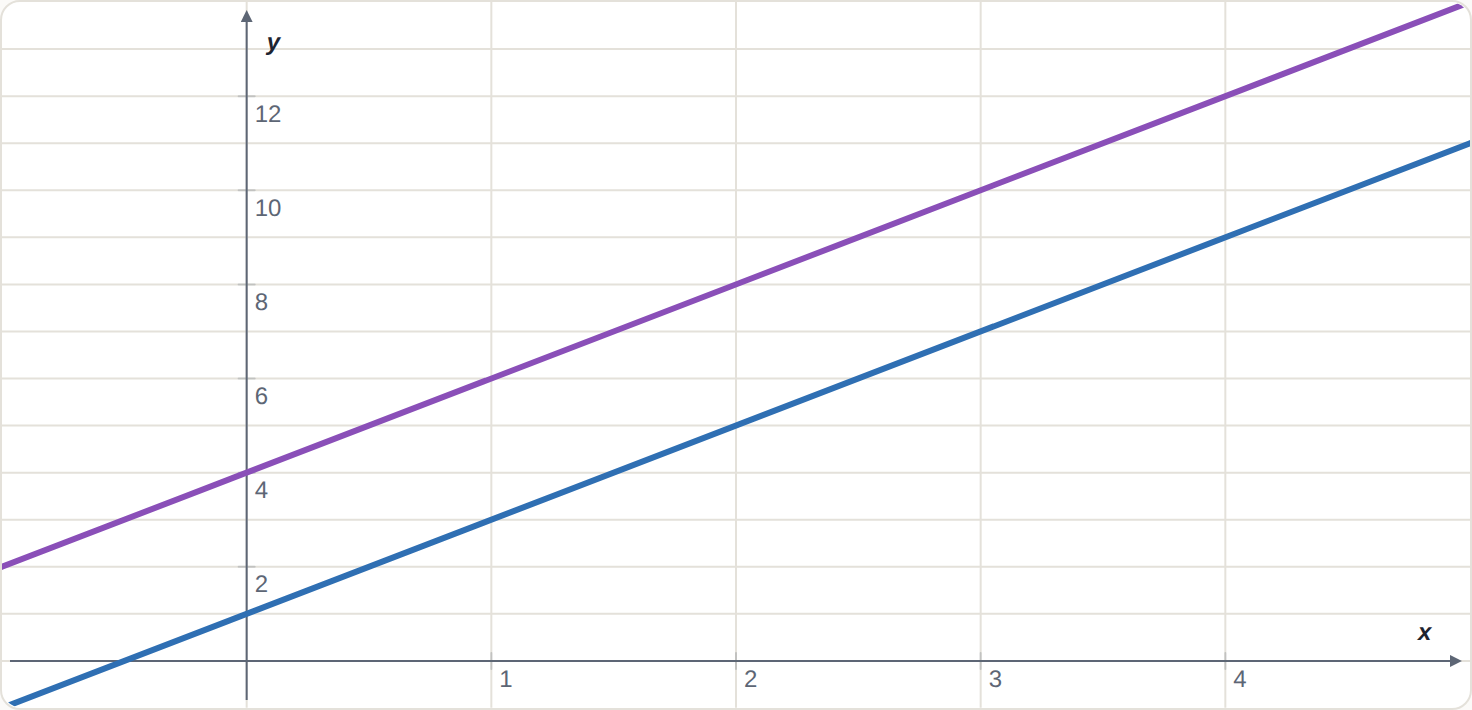
The same gives the same steepness, so the lines never meet. is moved up 3.
One letter: every point on has (a vertical line); every point on has (horizontal).
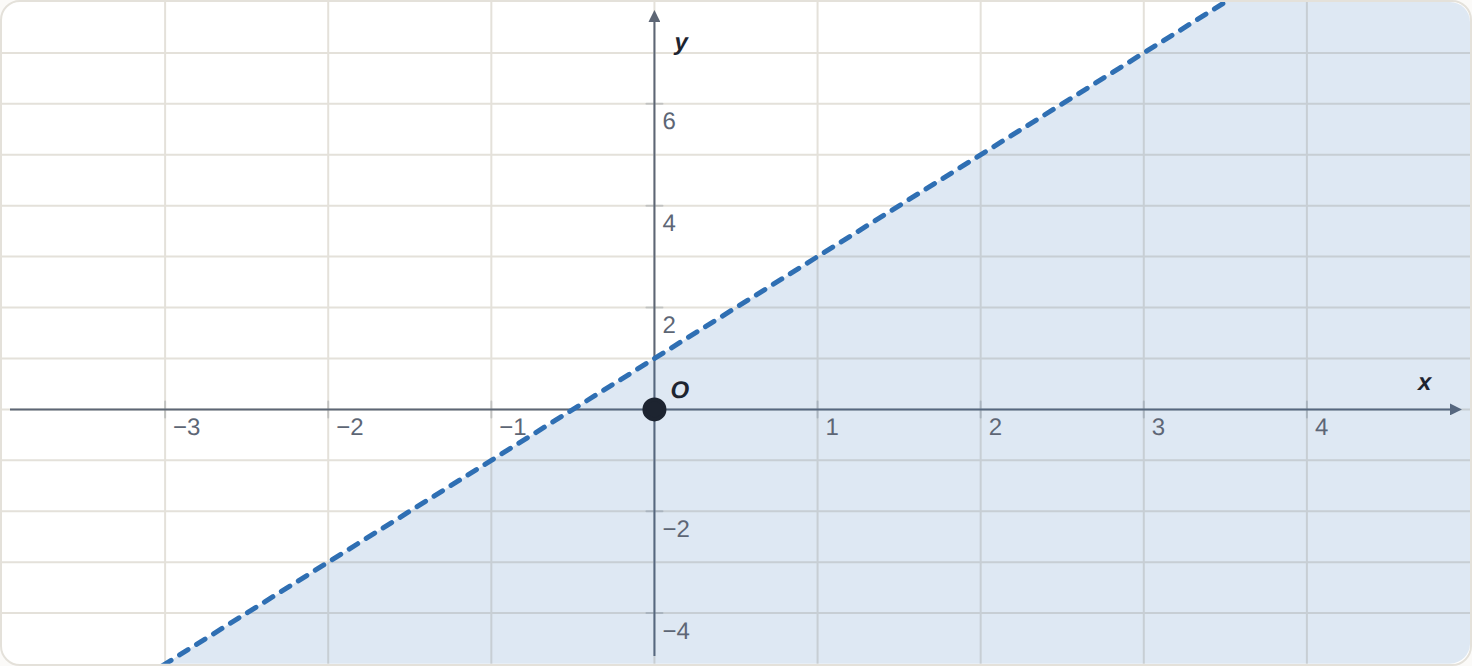
Draw the boundary : dashed for and , solid for and . Test a point such as : true, shade its side; false, the other side.
Solving and modelling
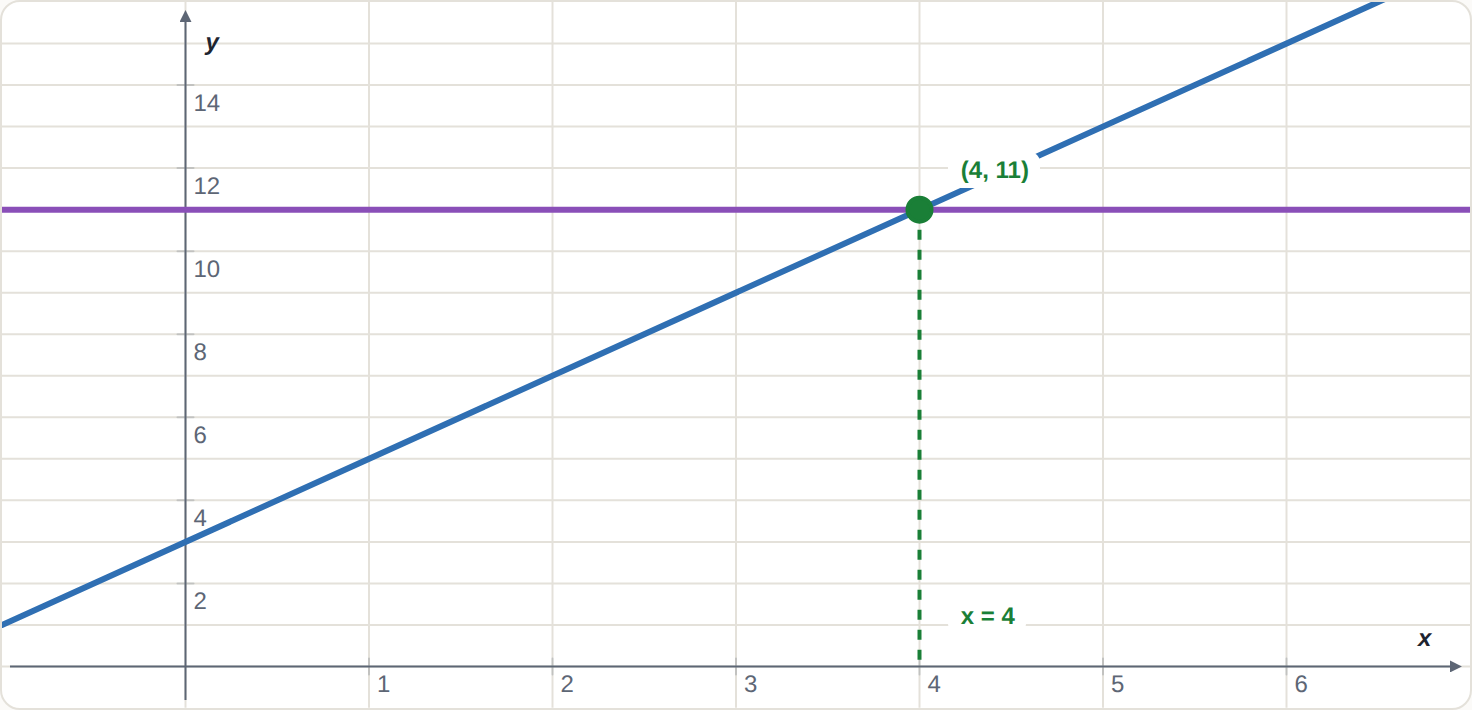
Draw each side as a line: and . Where they meet, both sides are equal, so the there is the solution.
A starting amount plus a rate: the start is (4 dollars to get in) and the rate is (2 dollars per km).
Put both rules on one graph. Where the lines cross, the plans cost the same; on either side, the lower line is cheaper. Check where the model makes sense (no negative gigabytes).