Lists and loops
Keep many numbers in an array, draw one thing for each with a loop, and build the array with random numbers.
Ten bars, or a thousand: it is the same few lines of code if the numbers live in a list and a loop does the drawing.
An array is a list of values in order: let heights = [50, 120, 80, 150];. Each value has a place number, counting from 0: heights[0] is 50 and heights[3] is 150. heights.length is how many there are (4).
A loop repeats code. This one counts:
for (let i = 0; i < heights.length; i++) {
  // runs once for each place number i
}
The hard part is that first line. Read it as three small instructions in a row: start with i at 0; keep going while i is less than the length; add 1 to i after each time round. You will copy it a lot before it feels natural, and that is normal. Inside the braces, i is the place number, so heights[i] is each value in turn.
heights.push(7) adds a value to the end, and random(20, 180) gives a random number from 20 up to 180.
- Predict: Read the code and say what it will do before you run anything. A wrong guess is fine: it shows you what to look for.
- Run: Run it and compare the result with your prediction.
- Investigate: Trace how each line of code connects to what you see.
- Modify: Change the code on purpose and check the result.
- Make: Build something new using what you have learned. Expect a few tries; that is normal.
Make your prediction first. Help opens once you've locked it in.
Predict
let heights = [50, 120, 80, 150];

function setup() {
  createCanvas(300, 200);
  background(240);
  for (let i = 0; i < heights.length; i++) {
    rect(i * 40 + 20, 200 - heights[i], 30, heights[i]);
  }
}
rect(x, y, width, height) puts (x, y) at the bar's top left, and y counts down. Where is the bottom of the first bar?
Run
The loop in setup() builds the array: ten random heights. The loop in draw() draws a bar for each one. Press Run again a few times. Change the 10 in i < 10 and run again.
let heights = [];

function setup() {
  createCanvas(300, 200);
  for (let i = 0; i < 10; i++) {
    heights.push(random(20, 180));
  }
}

function draw() {
  background(20, 30, 60);
  fill(255, 210, 0);
  for (let i = 0; i < heights.length; i++) {
    rect(i * 30 + 5, 200 - heights[i], 20, heights[i]);
  }
}
Investigate
let heights = [];

function setup() {
  createCanvas(300, 200);
  for (let i = 0; i < 10; i++) {
    heights.push(random(20, 180));
  }
}

function draw() {
  background(20, 30, 60);
  fill(255, 210, 0);
  for (let i = 0; i < heights.length; i++) {
    rect(i * 30 + 5, 200 - heights[i], 20, heights[i]);
  }
}
What the loop does each time round.
Counting from 0.
Bars hanging the wrong way.
heights is [50, 120, 80, 150]. Fill in what the loop uses each time round.
| i | heights[i] | the bar's top, 200 - heights[i] |
|---|---|---|
| 0 | 50 | 150 |
| 1 | ||
| 2 | ||
| 3 |
The bars hang from the top of the canvas instead of standing on the bottom. Click the line that is wrong.
Modify
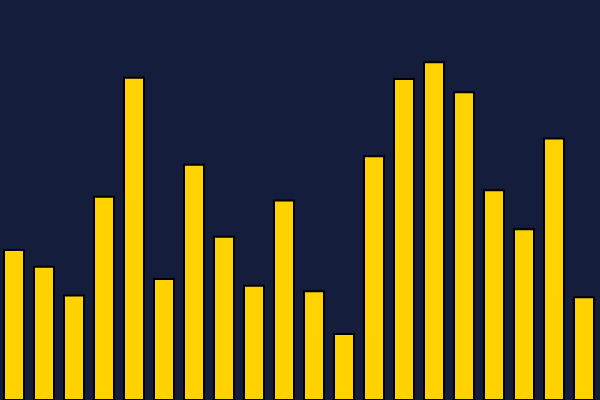
Draw 20 bars instead of 10, so they all still fit on the canvas.
Need a hint?
Two things control how many bars there are. One of them makes the values.
Another hint
Change 10 to 20 in setup(), and make the bars thinner and closer together so they fit.
Show the expected result
Colour the tall bars (over 100) differently from the short ones.
Need a hint?
Inside the loop, an if can look at heights[i] before the rect is drawn.
Another hint
if (heights[i] > 100) { fill(255, 120, 160); } else { fill(255, 210, 0); } goes above the rect line.
Show the expected result
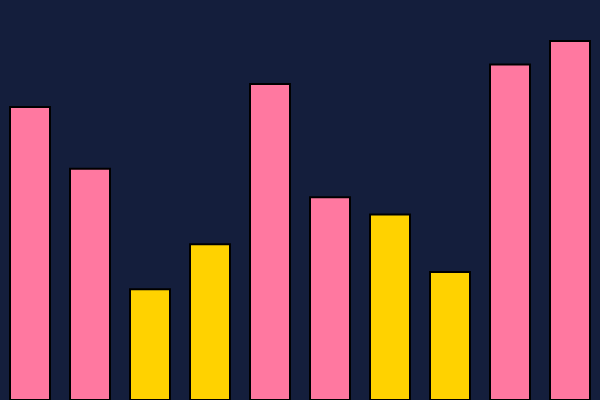
Colour the tall bars (over 100) differently from the short ones.
Run your program. This ticks when your code does all of the above.
Your own chart
Draw a chart of your own from a list of numbers: hours of sleep each night this week, scores, or random bubbles. Fill the array with the numbers you choose (let values = [3, 5, 2];) or with push, then use a loop to draw one thing for each value. Circles, bars, lines and coloured squares all work.
Use a loop to draw one thing for each value in your list.
Run your program. This ticks when your code does all of the above.
Where this leads
An array holds many values, and a loop does something for each. Next: an object holds everything about one thing, so a list of objects is a list of stars, balls or bars.
For teachers
Students keep numbers in an array, count places from 0, draw a bar for each with a for loop, build the array with push and random, find why bars hang from the top, and make a chart of their own. About 55 minutes.
Open the teacher guide: answers, solutions, slides and a worksheet.
Students will be able to
- I can keep many values in an array and read one by its place number.
- I can use a for loop to do something for every value in an array.
- I can add to an array with push, and use random numbers.
Before class
Read the unit primer first. This revisits the Python lists lesson in JavaScript: places count from 0, length says how many, and push is append. The new difficulty is the counting loop for (let i = 0; i < heights.length; i++): three parts in one line, which students copy until it makes sense; the lesson's text reads it aloud, and the trace table follows i and heights[i] together. The second idea is that rect hangs from its top-left, and y counts down, so a bar that stands on the bottom has its top at 200 - height: that is the Predict and the bug task. Random numbers make every Run different, so the Predict uses a fixed array.
Running the lesson
- Predict: draw the canvas on the board and mark the bottom of the first bar.
- Run: press Run again several times and ask what stays the same (the code) and what changes (the numbers).
- Investigate: fill the trace together, writing each i on the board.
- Modify: ask which two numbers must change for 20 bars to fit (the count and the spacing).
- Make: encourage real data (sleep, steps, scores), and ask students to say what each bar means.
The hard part (on purpose)
The three-part for line. Have students say it aloud: start at 0, keep going while less than the length, add 1 each time.
When students get stuck
- Nothing is drawn. Ask: Is the loop inside draw(), and is the array filled in setup()? Fix: The array must have values before draw() uses them: push in setup(), loop in draw().
- A red line: Cannot read properties of undefined. Ask: Does the loop go past the end of the array? Fix: Use i < heights.length, not <=. The last place is length - 1.
- The bars hang from the top. Ask: Which way does y count, and where is the top of a bar? Fix: The top is at 200 - heights[i]; the height stays heights[i].
- Only one bar shows. Ask: Are all the bars at the same x? Fix: Make x depend on i, for example i * 30 + 5.
Stretch and support
Stretch: Add a second array of names, and draw each name under its bar with text(). Or sort the data first with heights.sort().
Support: Give students the loop and the rect line, and ask them only to change the numbers and colours.
Where it leads
Next lesson: objects, so one list holds stars with their own position, speed and size.
What each step is for
- Investigate: A loop with a counter i visits each place in an array; heights[i] is the value at place i, and a rect hangs from its top-left corner.
- Modify: More data is a bigger number in the loop; deciding inside the loop makes each item different.
- your own chart: Goals only: a list of real or random numbers, and a loop that draws one thing for each.
- Keep many values in an array and read one by its place number.
- Use a for loop to do something for every value in an array.
- Add to an array with push, and use random numbers.