Chart your data
Open project · after lesson 5: Functions that decide
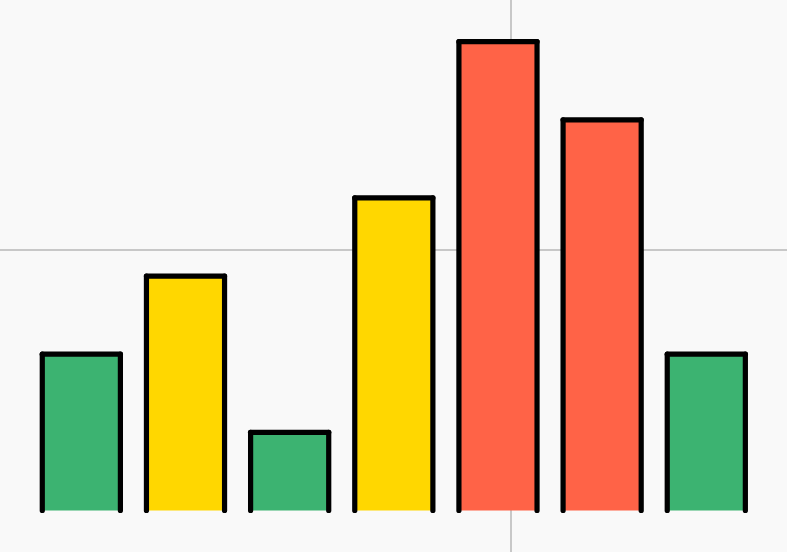
Choose something you can count (your week's screen time, the class's favourite fruits, rainfall) and draw it as a bar chart. A function decides each bar's colour from its value, so big and small values look different.
You'll use
These light up when your code uses them. Click one to see where you learned it.
Try it yourselfYour edits are saved in this browser.
Milestones
Tick each one when it is true of your project. Nobody marks it: be honest with yourself.
Make it yours
- Write each value above its bar with write().
- Draw the bars sideways.
- Add a line for the average.
Looking back
Tick every milestone first.
★ Chart your data
You built it with: